A Postmortem on the Circle Line Shutdown, Part 1: Why One Closure Affected So Many People
Why one closure affected close to 480,000 commuters.
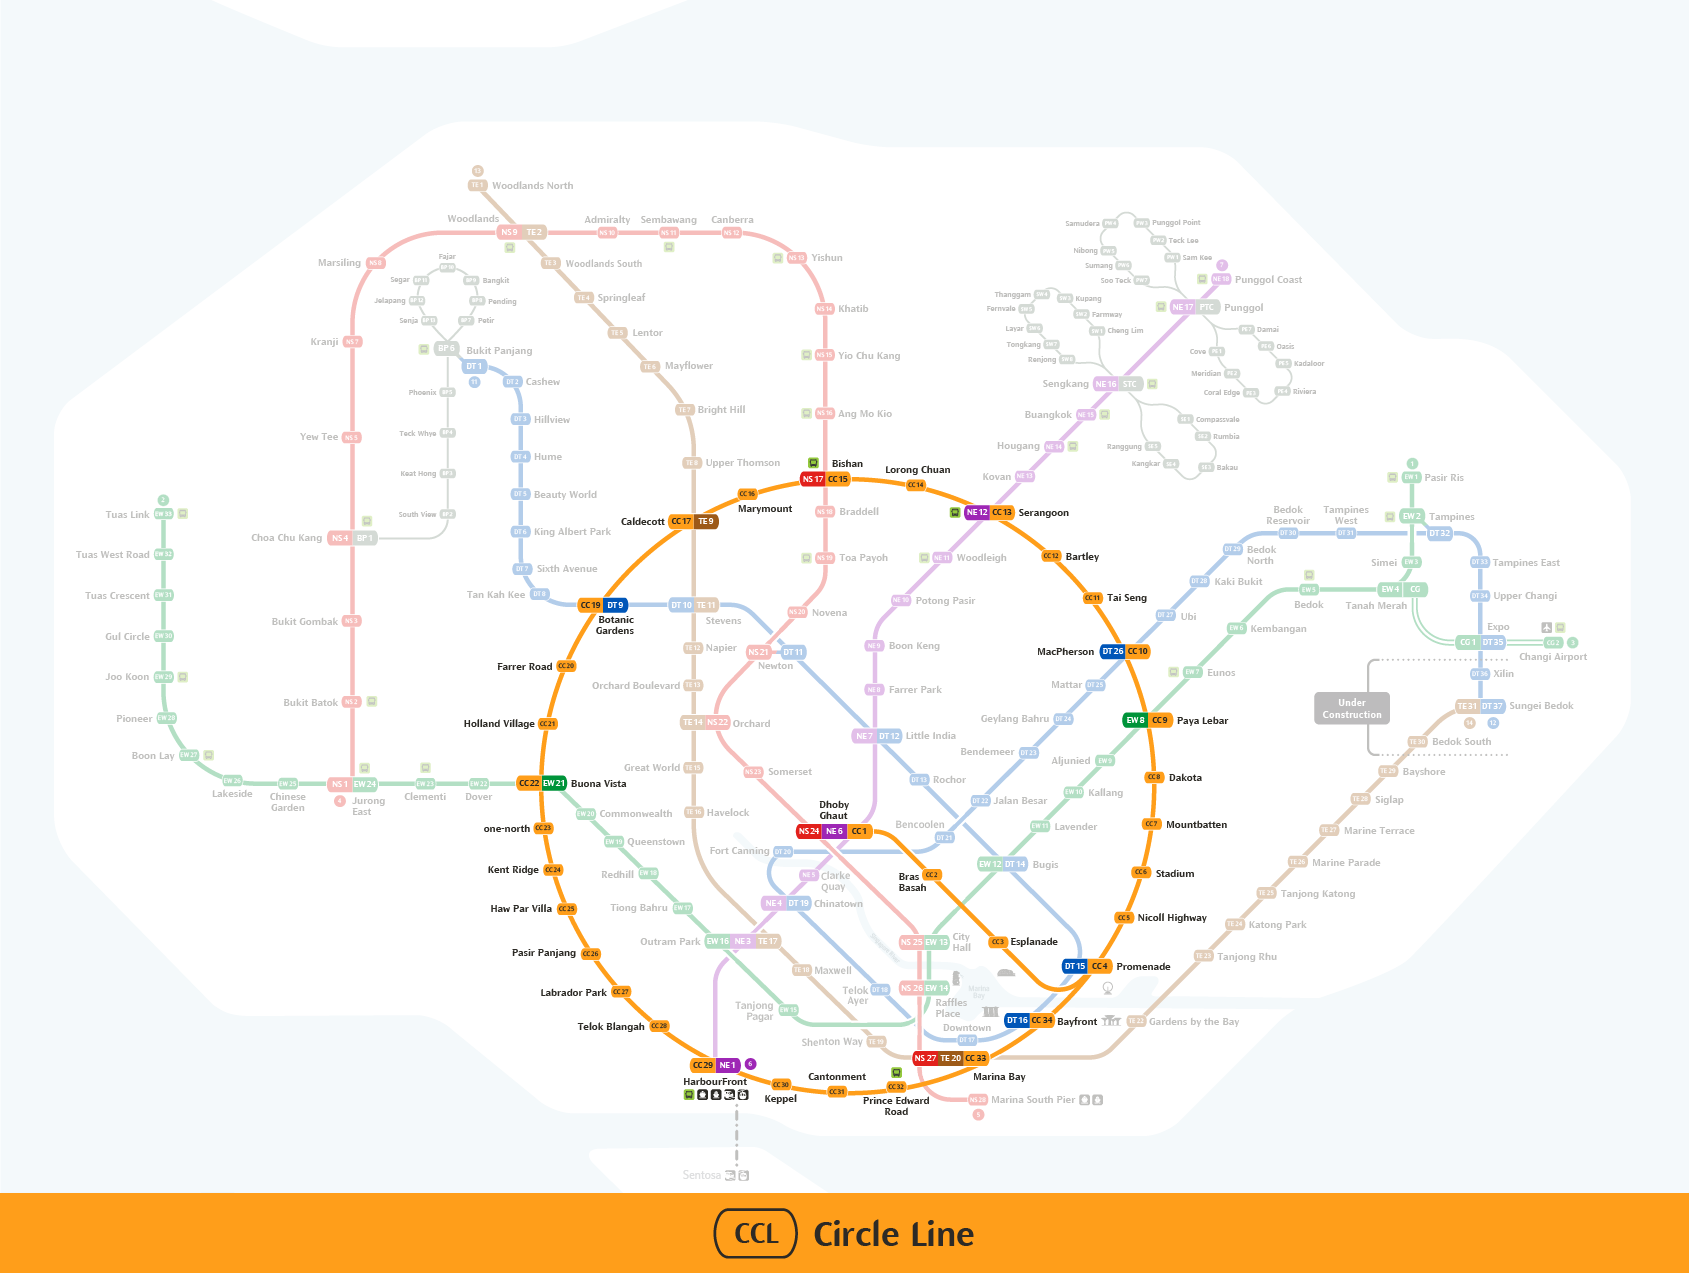
Between January and April 2026, the Circle Line was partially closed for tunnel reinforcement works. Most people saw it as a transport disruption.
I see it as a complete, real-world case study in network analysis with a clear before, during, and after. Every delayed journey, rerouted commuter, and crowded interchange revealed how geospatial algorithms work behind the scenes. The same concepts that help us navigate an MRT network are also used in Google Maps, logistics, emergency response, and urban planning.
This is Part 1 of a two-part breakdown of what happened, and the concepts that explain why.
Before: The Network Was a Graph With No Redundancy
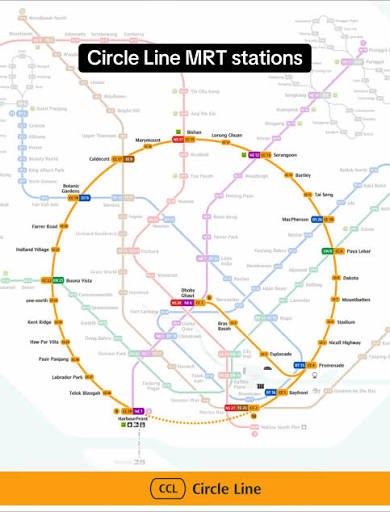
Before July 2026, the Circle Line was not a closed loop. It ran as an open arc from Dhoby Ghaut to HarbourFront. Every journey along the line depended on one continuous path. There was no alternate route within the line itself.
In December 2025, LTA announced that tunnel segments between Paya Lebar, Dakota, and Mountbatten needed reinforcement due to gradual deformation caused by soft marine clay. The affected stretch was closed for tunnel strengthening from January 17 to April 19, 2026. That is estimated to be about 93 days, which is the longest planned MRT disruption in Singapore’s history. About 480,000 commuters were expected to be affected.
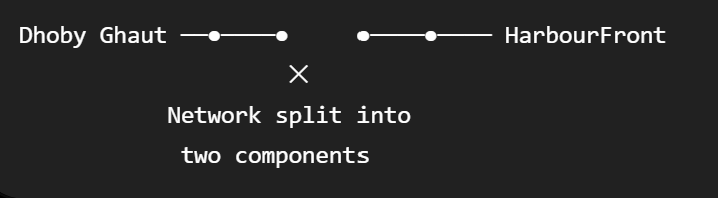
Because the line had no redundancy, removing one section did not just create a detour. It split the line into two disconnected parts. This is called a single point of failure: a component whose removal causes a significant loss of connectivity. Reducing single points of failure is a standard goal in resilient network design, applying equally to transport networks, power grids, telecommunications, and computer networks.
During: The Graph Changed, and Load Moved to Predictable Places
When the affected stations closed, several track connections were effectively removed from the graph, and shuttle buses were added as temporary replacement edges. LTA advised commuters to transfer at different stations than usual. For example, at Outram Park or HarbourFront instead of Serangoon.
When the network has been changed, the routing will recalculate the next cheapest path given the new graph. This is the shortest path problem. However, routing algorithms such as Dijkstra’s do not understand “MRT lines” as a concept. They operate only on nodes, edges, and costs, and return the best available route once the graph is modified. This is the identical mechanism behind live rerouting in Google Maps during road closures, and in emergency vehicle dispatch systems.
In this case, LTA specifically flagged Bishan, Serangoon, and Buona Vista as stations expected to see heavier congestion, despite none of them being part of the closed stretch.
This is known as betweenness centrality:
a measure of how many shortest paths pass through a given node.
Stations with high betweenness centrality are structurally more likely to absorb rerouted traffic when a nearby segment fails, because they already sit on a large share of alternate paths. This same metric is used to identify bottlenecks in road networks, plan disaster evacuation routes, and study airport terminal congestion.
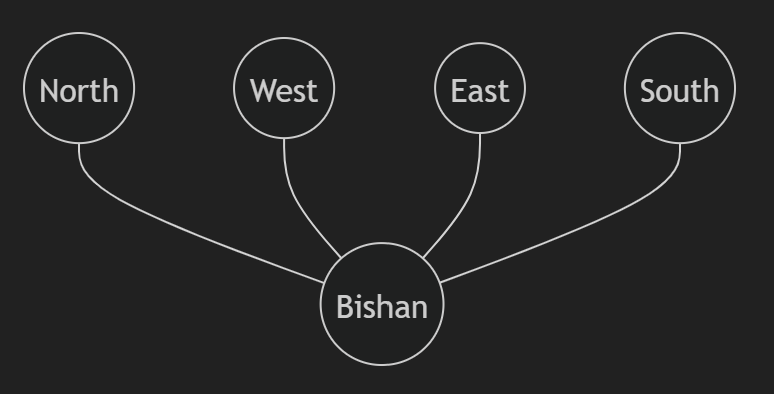
As shown in the diagram above, Bishan has high betweenness centrality. Many shortest paths naturally pass through it, so when nearby routes fail, congestion is redirected there.
Despite this, the disruption was managed within expectations. LTA reported the works “progressing smoothly,” with stations described as “not too crowded” partway through the period, and the project was completed nine days ahead of schedule, on April 10 instead of April 19.
That explains the congestion. But something else changed during the closure that had nothing to do with crowds, a shift you couldn’t see just from looking at a map, even though no station moved an inch. That’s where Part 2 picks up, along with what changed structurally once the Circle Line finally closed its loop in July.
🔧 Enjoyed the read?
Part 2 covers accessibility versus distance, and the topology change that made the Circle Line more resilient than it’s ever been.
I write about full-stack builds, system design, and geospatial engineering: from career platforms to network analysis, as I ship and study them.
Let’s connect:
~ Aishwarya